Valparaiso, Indiana: Modeling Chloride Contamination
Operation of a salt handling facility has resulted in the contamination of the aquifer below the facility with high levels of sodium and chloride. The main concern at this facility was the proximity of a municipal supply wellfield, located about 1,700 feet north. Groundwater monitoring has confirmed the movement of salt at the base of the aquifer toward the wellfield.
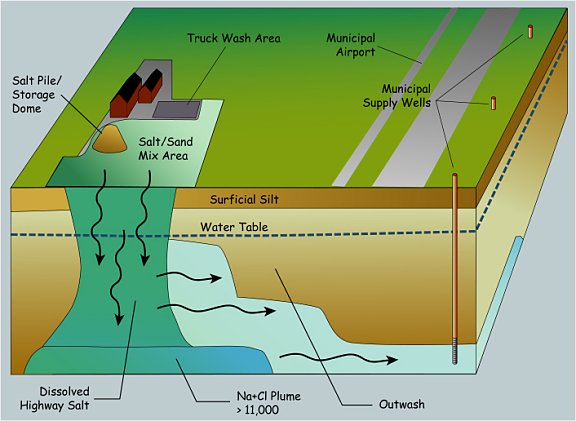
Diagram of Valparaiso Chloride Plume
Groundwater modeling was done at this site to aid in the design of remedial alternatives. Initial model calibration involved the use of a single-phase flow model. The flow model was calibrated to steady-state and transient conditions. A 2-phase, sharp-interface model was then used to simulate the historical migration of a dense salt plume at the base of the aquifer beneath the facility. Concurrently, a solute transport model was linked to the transient simulation. The solute transport model was used to simulate the dispersive movement of salt from the dense phase plume into the surrounding aquifer. The sharp-interface model was used to simulate salt migration over the 30 year operational period of the facility.
Numerical groundwater models were developed and applied to evaluate the effectiveness of alternative remedial pumping scenarios. Three types of groundwater models were used. All three models were fully 3-dimensional and linked by a shared model database. The three model types are:
Groundwater flow model (single phase), DYNFLOW - incorporates the physical characteristics of the aquifer and computes the distribution of groundwater flow and head in response to pumping, recharge and other boundary conditions.
2-Phase flow model, DYNSWIM - an extension of the single phase flow model which incorporates two interacting fluids of different density, i.e., saltwater and (relatively) fresh water.
Solute transport model, DYNTRACK - computes the advection and dispersion of dissolved solutes in groundwater using flow fields computed by the flow models; does not include any fluid density effects.
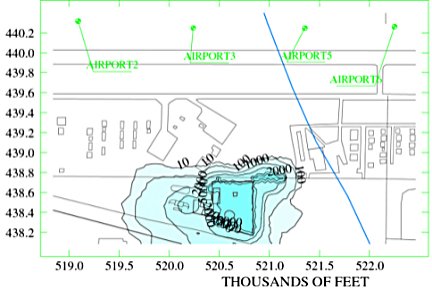
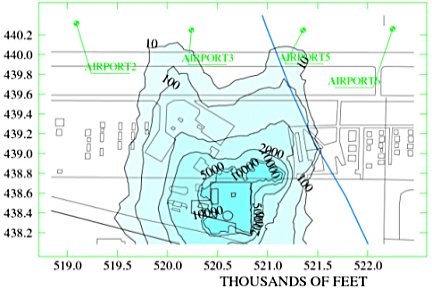
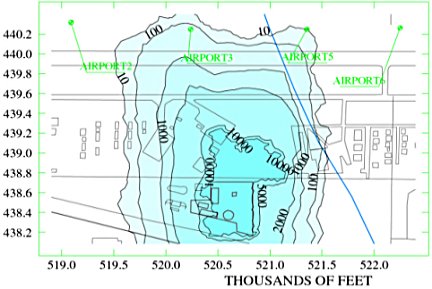
These figures show the simulated development of the deep salt plume for the years 1976, 1988, and 1997.
The following picture shows the chloride plume in cross-section with chloride concentrations plotted in DYNPLOT.
DYNPLOT Material Plot in Cross-Section
The following two pictures show simulated chloride concentrations during a remediation simulation in recovery wells and in municipal pumping wells. These pictures are created in a spreadsheet program using results directly from DYNTRACK.
Simulated Chloride Levels in Recovery Wells
Simulated Chloride Levels in Municipal Wells